
|
This is Part 2 in Fairfield Taxpayer’s initial series on this subject. Part 1 addressed “What is a Strategic Plan?” and why we agree that having one would be good for our Town. Part 2 addresses the important questions: “Where are we and how did we get here?” and Part 3 will address the ultimate questions that every Strategic Plan should answer: “Where should we go and how should we get there?” Finally, Part 4 will recommend some “Next Steps.” We begin Part 2 with a brief summary of our views on the “State of the Town,” and we encourage everyone to read the views expressed earlier this year on the same subject by First Selectman Tetreau [4] and RTM member (and now First Selectman candidate) Chris Tymniak. [5] (Please find links to their remarks on the first page of Part 2.) Our views are offered, as we hope many others will be, not as definitive, but as constructive contributions to a much broader discussion that engages as many Fairfield stakeholders as possible. A Great Town with Some Serious Challenges Fairfield Taxpayer (FT) believes that Fairfield is a great town that faces some serious challenges. Our Town is great for many reasons, including its physical beauty and New England charm, its beaches and other recreational facilities, its diverse and vibrant cultural life, its strong civic, religious and community organizations, two thriving universities, its AAA credit rating, good schools and other public services, and its proximity to both New York City and Boston. However, Fairfield also faces some daunting challenges that will make it much more difficult to continue to prosper, including: much less favorable general economic conditions than prevailed during the happy days when our tax base was growing strongly and could absorb at least some of the substantial increases in spending and taxes; structural barriers that prevent us from controlling the major driver of higher spending and taxes, which is the relentless growth in the cost of public labor; high property and state taxes that are hurting property values by driving more and more residents to leave, particularly seniors and others who do not have children in our schools; and infrastructure problems that seem to be beyond the State’s ability to fix, including deteriorating Metro-North train service and chronic traffic congestion on I-95, the Merritt Parkway and in Fairfield itself. After 18 years of increases in our total spending and taxes at 2.5x-3.0x the rate of inflation without comparable growth in our tax base, higher taxes have made Fairfield increasingly unaffordable for many of its residents, which, on top of excessive spending and taxing at the state level, is driving more and more residents to leave and hurting our property values, particularly at the higher end of the housing market where prices remain under severe pressure. One need only drive around and count the many aging “For Sale” signs in Greenfield Hill, the Beach area and Southport to realize that many residents and potential buyers feel that Fairfield is not where they prefer to live. Unless we can reverse this housing deflation, it is only a matter of time before it spreads as the tax burden that higher-end homes once carried is shifted onto other residents and the ranks of unhappy homeowners grow. [6] Because labor costs are 70%-80% of our total spending, the only way to get our spending and taxes under control is to restrain the growth in the cost of wages, benefits and restrictive work rules for public employees. However, over the last 12 months, Town bodies have approved yet another series of labor contracts for teachers, school administrators, department heads, police and fire that for the next several years will continue to drive 3%-4% annual increases in labor costs – increases that are much greater than either the rate of inflation or the growth in the incomes of the people who are expected to pay for them, otherwise known as taxpayers. We will discuss all of these challenges in this section. SWOT Analysis As noted in Part 1 of this series, a useful exercise in the first stage of strategic planning is to identify strengths, weaknesses, opportunities and threats, which we have attempted to do below. We look forward to much refinement to this list as others suggest additions and deletions, and as we all learn more about where we are and how we got here. Strengths:
Weaknesses:
Opportunities:
Threats:
Drawing from this list, we elaborate below on what we feel are the most important issues that Fairfield’s strategic plan should address, including some related key new economic realities. The New General Economic Reality Perhaps the most important new reality is that general economic conditions have changed for the worse with GDP, jobs and personal incomes growing only slowly in the U.S., and even more slowly in Connecticut. This is a big change from the way things were over the lifetimes of most American adults, upon which basis we have formed our collective understanding of how the world works. For 60 years after WW II, notwithstanding some cyclical ups and downs, things just kept getting better as the United States increasingly dominated the global economy and generated lots of good-paying jobs in the process. Virtually everyone enjoyed remarkable increases in income, and even greater increases in living standards and “material well-being” (thanks to the benefits of technology, free trade, and lower distribution costs). Even when incomes leveled off in the years before the Great Recession, the benefits of technology, free trade and lower distribution costs continued to boost purchasing power, allowing standards of living to continue to rise. And even after the Great Recession, historically low interest rates allowed homeowners to refinance their mortgages to maintain their discretionary income. We now face great challenges as favorable economic tailwinds have become turbulent headwinds. In the six years since the official end of the Great Recession, economic growth has been slow, good jobs have been much harder to find (CT has still not recovered all of the 119,000 jobs that it lost in the Great Recession, and has generated no job growth for 26 years), and incomes are still under pressure. This pressure has been particularly strong on seniors who depend on interest income on their retirement savings and on pensions that are tied to COLAs that, in turn, are tied to the rate of inflation. Incomes for many Fairfield residents are still down significantly from where they were in 2008, and yet over this same period Fairfield’s tax levy has risen 36% (to $273.5 million in 2015-16 from $201.6 million in 2007-08). Since our tax base is down 7% over the same period (to $15.8 billion from $16.9 billion), our “real” tax rate (tax levy / tax base) has risen 45% to 1.73% from 1.19%. Competing Successfully in the Long-Term Residential Community Business Since Fairfield is no longer an agrarian community where most people spend their entire lives and pass their properties on to their children to do the same, we must now compete to attract and retain customers in what is essentially the “Long-Term Residential Community” business, in which the average tenure of a resident is about 17 years. The Town’s ability to continue to succeed in this business depends on: (a) providing good residential services (e.g., public safety, roads, schools) and maintaining a good residential culture that make it a desirable place to live; and (b) providing these services at a price (a.k.a., taxes) that represents good value to existing and potential customers. In order to continue to prosper, Fairfield must be both desirable and affordable. It cannot be desirable if it’s not affordable, and being affordable will not matter if it’s not desirable; getting the balance right is crucial. One of the biggest challenges in the Long-Term Residential Community business is attracting residents who are willing to pay for services they do not use, particularly the cost of education. At $185 million, education represents over 63% of Fairfield’s total spending, but only 30% of our households have children in our schools. Consequently, the people most likely to leave are those who do not have children in our schools, and the people most likely to buy their homes are families with school-age children. This turnover, driven on the one hand by rising taxes, and on the other hand by a relatively large supply of affordable homes (with a median selling price of only $525,000) in a wonderful town with good schools, may explain why Fairfield has experienced continued growth in school enrollment at a time when many other Connecticut towns have seen their school enrollments shrink. It is families with children in our schools who are most likely to agree with Mr. Tetreau [8] that Fairfield is “the best value in the State” and/or “the best value in Fairfield County,” because the value of the benefits they receive substantially exceeds what they pay for them. By paying property and motor vehicle taxes on a median $525,000 Fairfield home of ~$10,000 before taxes and ~$8,000 after taxes, a family receives around $4,000 [9] in municipal services (e.g., police, fire, roads, beaches, parks) plus, on average, $18,000 per student in educational services. The combined annual net benefits (i.e., the value of benefits minus the after-tax cost paid) are therefore $14,000 for a household with one student; $32,000 with two students; and $50,000 with three students. After 17 years (the average resident’s tenure), assuming all children complete 13 years of public education, cumulative net benefits are $166,000 (one student), $400,000 (two students), and $634,000 (three students). Net benefits are obviously greater for less expensive homes and vice versa. [10] Any realized net capital gain from the eventual sale of the home increases the net benefit, and vice versa. Living longer in Fairfield before or after the children complete 13 years of K-12 education reduces the net benefit by $4,000 per year. 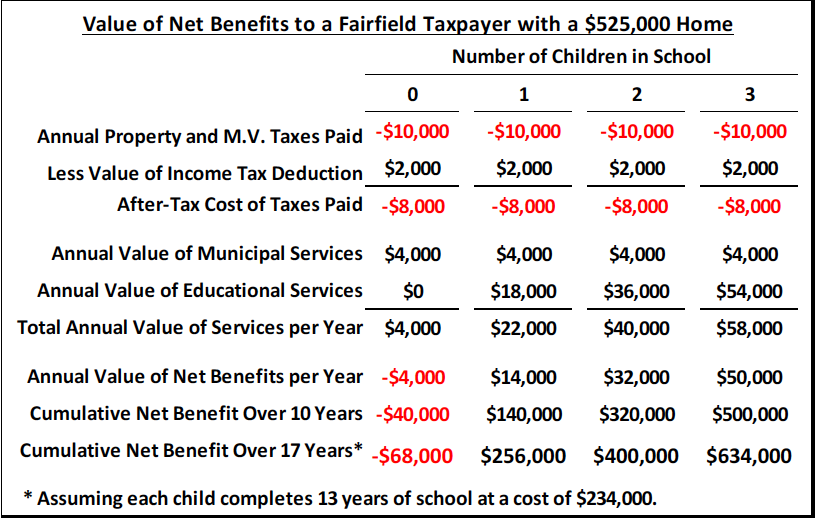 Not surprisingly, many if not most parents with children in our public schools do indeed think Fairfield is a great value, and do not share the concerns expressed by many other residents about the need to restrain spending and taxes. Encouraged by well organized groups like the PTAs, who are in turn encouraged by school administrators and teachers, these parents get out and vote and are also highly vocal at public meetings in support of spending on education, with recurring slogans like, “the children are our future,” and “great schools support property values.” The Fairfield Citizen described the scene at the 2014 budget meeting as follows: “The pro-education budget rally, organized by the PTA Council, drew about 60 people, many wearing tee shirts urging ‘no cuts’ and carrying placards urging support for the full school budget.” [11] Since there is no organization with comparable resources to the PTAs and Teachers Union urging the other 70% of Fairfield households to speak out and vote, it is easy for the 30% to become a majority in municipal elections for which on average less than 50% of registered voters turn out to vote, and sometimes less than 30% (2009 and 2013). However, even parents who are benefitting most from the system must eventually acknowledge the new economic reality we face and restrain the growth in our spending and taxes, because otherwise it is only a matter of time before everything we love about Fairfield will be at risk, including our schools. It is simply not possible to restrain our overall spending without restraining the cost of our schools, which as noted above represent over 63% of our total spending. And, since labor costs represent 80% of the BOE budget, we simply cannot restrain the cost of our school system if we continue to grant generous increases in compensation to teachers and school administrators. The Critical Need to Control Labor Costs Labor costs represent at least 70% of total town spending, and perhaps as much as 80%. [12] Thus, we cannot restrain our total spending unless we restrain labor costs. During America’s extraordinary period of rising affluence, we unfortunately developed some bad habits that will not serve us well in the new economic reality we face. For example, as long as the rising tide of general prosperity was lifting all boats (and all home values), it didn’t seem to matter that we granted more and more generous compensation packages to public employees, and it didn’t seem to matter that the Town bodies responsible for approving these contracts did so without considering their longer-term consequences. As long as things kept getting better, neither the politicians nor the voters who elected them were forced to accept responsibility for the long-term consequences of their actions (or inactions). And when things did get bad enough in some towns, cities, regions and states, people simply began to “vote with their feet” by moving somewhere else, which is exactly what more and more people in Connecticut are doing. [13] As noted earlier, Fairfield’s spending and taxes have increased at 2.5x-3.0x the rate of inflation over the past 18 years NOT because we added proportionately more and/or better public services, but primarily because the cost of public labor escalated sharply due to increasingly generous wages, benefits and work rules, as throughout the State strong, well-organized public employee unions dominated at the bargaining tables against weak, short-sighted, politically motivated government negotiators who were supposed to be representing the taxpayers. And the same unions were equally successful as lobbyists at enacting legislative protections like binding arbitration, prevailing wages (a rule that substantially increases the cost of public construction projects), and constitutional pension protections. It should also be noted that the unions are not merely good at the bargaining table and in the State capitol, they also understand the power of political intimidation. The standing-room-only crowds that have been showing up at Fairfield’s Representative Town Meeting (RTM) when contracts are being considered, and who are cheering and applauding when the RTM votes to approve them, are not a representative sample of the general public. Instead, they are largely direct beneficiaries of the contracts and budgets being approved, many of whom (70% in the case of police and fire) don’t live or pay taxes in Fairfield. The Fairfield Citizen described the meeting room as “packed” with teachers on November 24, 2014, [14] and “packed” with firefighters and police officers on July 27, 2015, [15] when their new contracts were approved. No matter how much we love and respect our teachers, administrators, department heads, firefighters, policemen and other Town employees, continued high increases in their compensation at the state and local level are simply not sustainable. According to the Bureau of Labor Statistics, as of June 2015, total compensation for state and local government workers was 41% higher ($44.22 per hour) than for workers in private industry ($31.38), with wages and salaries 29% higher and benefit costs 67% higher. [16] Note that these figures do not take into account any of the work rule restrictions that further raise the cost of public-sector labor by limiting productivity. Public employees should be compensated in line with comparable private-sector employees rather than at a substantial premium, including overly generous pension and healthcare plans that are not available in the private sector to the people who must pay for them. FT believes strongly that the relentless increase in the cost of wages, benefits and restrictive work rules for public employees is the single most important challenge to the future prosperity of both our Town and our State. That neither the Town nor the State has been able to even acknowledge the problem of excessive public employee compensation, let alone address it, is ultimately attributable to two factors: first, the widespread short-termism on the part of both politicians and the voters, none of whom is forced to accept responsibility for the long-term consequences of their actions (or inactions) and are happy instead to move elsewhere if circumstances change for the worse in their neighborhood, town, region or state; and second, the widespread complacency created over many years of post-war prosperity, when it just didn’t seem to matter what public employees were paid because everyone’s “material well-being” along with home values just kept rising. Here is a summary of what has been going on with Fairfield’s recent labor contracts, as a result of which public employees will in general get annual increases in salary and healthcare benefits of 3%-4% over the next three years that will put them about 20% above where they were in 2008 while the incomes of many of the taxpayers who must pay for those increases are still below where they were in 2008. Teachers: On November 24, 2014, the RTM approved by a vote of 37-7 a generous three-year contract for Fairfield’s teachers in the mistaken belief that it would increase the combined cost of salaries and healthcare benefits by only 1.7% per year (instead of what was actually 3.6% per year), and that the BOE budget this year would increase less than 2% (instead of what was actually 3.5% by the time it was finally approved). With only a few exceptions, RTM members were content to repeat platitudes about the importance of education to our children and our property values, and to simply move on and forget that they were misled into approving a contract that was not in the best long-term interests of the Town. Meanwhile, the people responsible for misleading the RTM managed to avoid even having to acknowledge their culpability, let alone being held accountable.[17] School Administrators: On December 15, 2014, Fairfield’s RTM narrowly rejected a proposed three-year labor pact for Fairfield Public School’s (FPS) administrators by a vote of 21-20. After the union prevailed in the ensuing mandatory arbitration process (in which the people representing the taxpayers decided to focus solely on healthcare benefits rather than total compensation), exactly the same contract came back to the RTM on March 19, 2015, and was approved by a vote of 23-7. 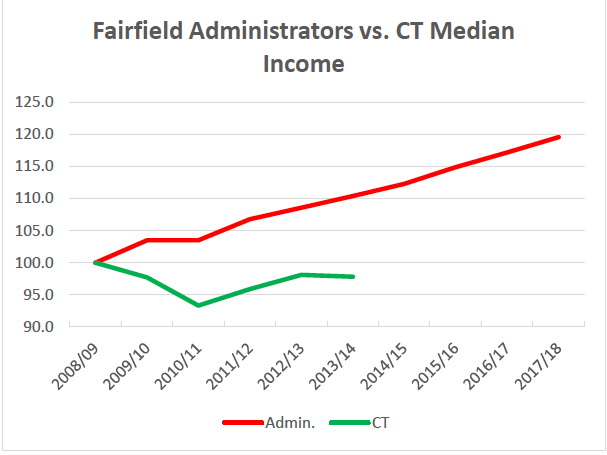 To put this contract in context, School Administrators were already receiving average salaries of $150,000 per year (some of them well over $200,000). The Superintendent of Schools (who is not a member of this union) is paid even more, at $289,000. In contrast, Fairfield’s First Selectman is paid ~$131,500, the Director of Public Works ~$135,000, Fairfield’s Chief Fiscal Officer ~$137,000, the Chief of Police ~$144,000 and the Fire Chief ~$149,000. By the way, the median salary for general-practice physicians in Fairfield is ~$205,000. [18] Under the new contract, Administrators’ salaries will increase another 6.5% over the next three years to an average of $159,423, for a total gain of 20% from 2008/09 to 2017/18. Including benefit costs – social security, Medicare, pensions, disability (60% of salary with no limit) and life insurance (2.5x salary), healthcare insurance ($12,564 for a single employee, $26,933 for a married employee, and $34,859 for a family as of 7/1/2018) [19] – the “total compensation” numbers are approximately 25% higher. [20] Thus, including benefits, the lowest paid administrator is supposed to make ~$150,000 and the highest ~$230,000. Including benefits, the Superintendent is well over $300,000. In addition, the contract specifies a 225-day work year, and grants, with full pay, 23 days (4½ weeks) of vacation (five of which can be taken during the student year, and five of which can be carried over to the next year), 15 sick days (which can be accumulated up to 150 days), 5 personal days for a death in the family, plus 5 personal days for any other acceptable reason (including the observance of major religious holidays), including one private day with no restrictions. Three additional days are allowed at reduced pay (i.e., the difference between regular pay and the cost of a substitute). Not including bereavement leave, administrators are entitled to 43 days off (or 8½ weeks) with full pay. Department Heads: On May 4, 2015, with no acknowledgement that there is any problem whatsoever with continued unsustainable increases in public employee compensation, the Board of Selectmen unanimously granted average salary increases of 2%-3% to most Department Heads and granted 2.5% annual increases in each of the next four years (i.e., 10.4% overall) to themselves (or whoever the selectmen will be after the November election). Moreover, they did so without even considering what these increases would mean for the increase in total compensation, simply because the First Selectman asserted that under the Town Charter, the BOS can review and approve salaries, but not benefits. However, what Article V, section 5.2 of the Charter actually states is this: “Except as provided in this Charter or otherwise by law, the compensation of all Town officers shall be fixed by the Board of Selectmen subject to the adoption of the Town budget as provided in Article XII of this Charter.” Note that this clause uses the word “compensation” rather than “salaries.” Police and Fire: On July 27, 2015, the RTM approved by a vote of 31-0-7 new contracts for Police and Fire. Having been earlier misled into believing that the annual cost of the new teachers’ contract would be only 1.7% (instead of an actual 3.6% per year), [21] our RTM representatives still did not bother to challenge the assertion that with 2.5% annual increases in salaries and with an 8% trendline in healthcare costs, the increases in the total cost of the new police and fire contracts would be only 2.05% and 2.09% (later revised up to 2.24% and 2.30%), respectively. In fact, these cost-increase numbers were understated primarily by a fortuitous drop in the cost of healthcare and OPEB (Other Post-Retirement Benefits) over the past two years (which are also the first two years of this long overdue contract), both of which could easily reverse over the next two years. Excluding these non-recurring windfalls, the increase in the annual cost to the Town is actually 3.35%, right in line with the recent 3.2%-3.6% increases for teachers, school administrators and department heads. Meanwhile, the Town remains completely at risk for the future cost of generous retirement benefits that, for example, allow retirement either at age 51 or 25 years after date of hire, with a pension equivalent to 70%-80% of ending salary, with up to a 3% annual cost-of-living increase, and with full healthcare benefits. With life expectancies continuing to rise, this means the Town could easily be paying firefighters and police officers for more years in their retirement than they served on active duty. 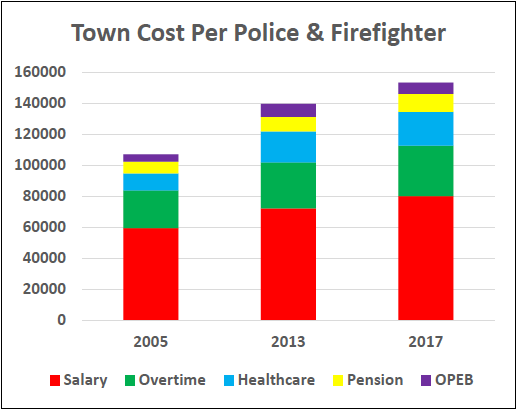 Huge Liabilities for Pensions and OPEB (Other Post-Employment Benefits) Notwithstanding the fact that every rational private-sector and nonprofit company has already replaced their defined-benefit retirement plans with defined-contribution plans, the debate on this subject at the RTM continues to focus narrowly on the short-term cost of having to pay Social Security on both salary and overtime, and to ignore the potentially massive cost to the Town if investment returns are significantly below the assumed rate of 7.5%. According to the Town’s Comprehensive Annual Financial Report (CAFR),[22] even though our pension plans are almost fully funded (99%), every one-percentage-point in lower investment return would increase our net liability by a staggering $46 million. A presentation by the Town’s actuarial firm (Hooker & Holcombe, or “H&H”) to the Board of Finance (dated 2/25/15 and 3/3/15) [23] indicates that as of 6/30/14, just a 1.5 percentage-point decline (from 7.5% to 6.0%) would increase our annual pension cost by $10.8 million (or 3.7% of our total budget of $291 million). Anyone familiar with the stock market knows that the risk about which we should all be concerned is not a minor one- or two-percentage-point shortfall, but a 20-percentage-point drop (a.k.a., a Bear Market) followed by zero returns for an extended period. Meanwhile, as of 6/30/14, the Town (including Police and Fire) also had a $102 million unfunded liability for Other Post-Employment Benefits (OPEB), which is primarily healthcare insurance for retirees. Although Fairfield, unlike many Connecticut towns, deserves full credit for having any long-term OPEB funding in place (and for funding its annual required contribution for both Pensions and OPEB), our total OPEB liability is only 17% funded. There is no “sensitivity analysis” in the CAFR or the H&H report that tells us what happens to our net OPEB liability with every one-percentage in lower investment returns, but the actuarial accrued OPEB liability is around $123 million, which is about one-third of the pension liability of $356 million, and both numbers are based on an assumed 7.5% annual return. So an educated guess would be that a relatively small 1.5-percentage-point decline in the rate-of-return assumption would increase the Town’s combined annual cost by $14.5 million, or 5% of our total spending. If this happens, and it could just as easily be a 10% increase, we will be forced to cut spending (not just any increase in spending) on all other public services. As noted earlier in the discussion of labor costs, during America’s extraordinary period of rising affluence we unfortunately developed some bad habits that will not serve us well in a more challenging economic environment. One of those bad habits is the widespread belief and expectation that the strong investment returns during that period were “normal” and will continue. Accordingly, we have created post-retirement benefit systems that do not put aside enough money to cover their future cost because we think a very substantial portion of that money will magically and painlessly come from high investment returns on the money we do set aside. To appreciate the magnitude of our dependence on strong investment returns, consider the simple fact that if you would like to work for only half the adult years (say, 30 out of 60) that you (and/or your surviving beneficiary) would like to enjoy the same standard of living, and if you assume a zero return on the money you save and no help from any other source (like Social Security), you would have to save half of your income. [24] Now consider that Fairfield’s firefighters and police officers contribute only 4.75% (just increased from 4.5%) of their salary to their pensions, and that the Town will contribute another 22.24% this year (in line with a five-year average of 22.5%), for a total of 27.0%. Yes, there are many details we are ignoring in this simplistic analysis, but the difference between 27% and 50% provides some idea of the huge gap that we are relying on investment returns painlessly to fill. It is critically important for everyone to understand that the Town (i.e., the Taxpayer) bears all of the risk if the cost of post-retirement benefits turns out to be greater than expected, whether because investment returns are below 7.5% annually, because beneficiaries on average live longer than expected, because we are amortizing unfunded liabilities over more years than the average remaining years of employment, and/or because inflation in healthcare costs is higher than has been assumed. Governance Fairfield’s government is run almost entirely by well-meaning volunteers who often don’t have the time or expertise to understand the full consequences of the important decisions they are making, who often base their decisions on flawed analyses and simplistic platitudes, and whose only accountability is that they may not get reelected to a time-consuming position that pays them nothing. Among other things, these amateurs are no match for the professionals who represent the public employee unions, particularly on the uneven playing field created by pro-union state laws like binding arbitration. The new Police and Fire contracts provide yet another example of the RTM rushing to judgment and failing to take the time to understand the numbers and their long-term consequences for the Town. Another example of the weakness of our current governance system is the growing number of significant cost overruns and delays (e.g., Riverfield, Osborn Hill, Fairfield Ludlowe High School, Penfield Pavilion) on public building projects, responsibility for which has traditionally been delegated by the First Selectman to ad hoc building committees. Accordingly, it is important for everyone to understand that the Town’s future rests importantly on the quality of leadership we get from the one full-time elected official with broad powers, our First Selectman. We should all reconsider whether our current form of government is appropriate for a small city with a $300 million budget facing many serious challenges. Summary and Conclusions In summary, in answer to the questions, “Where are we and how did we get here?” Fairfield Taxpayer believes that Fairfield is a great town with some serious strategic challenges, the most important of which are the following:
CLICK "Read More" below for comprehensive footnotes [4] http://www.fairfieldcitizenonline.com/opinion/article/State-of-the-Town-in-Tetreau-s-view-Fairfield-is-6061273.php#page-1
[5] http://www.fairfieldcitizenonline.com/opinion/article/State-of-the-Town-as-seen-by-GOP-Best-days-lie-6062170.php [6] For more information, please see Fairfield Taxpayer’s “Update on Fairfield’s Property Revaluation”: http://www.fairfieldtaxpayer.com/uploads/1/1/1/8/11185705/fairfield_revaluation_update_final_revised_8.12.15.pdf. Readers may also be interested in, “The Coming Great Compression in Residential Real Estate Values”: http://patch.com/connecticut/fairfield/the-coming-great-compression-in-residential-real-estate [7]]https://docs.google.com/spreadsheets/d/19h_jdKRGFOQLWz5XWZpBJPUcWMgcetFkrRC0hYEzcLk/edit?pli=1#gid=0 [8] See: http://www.fairfieldct.org/content/10726/15800/17966.aspx, and also: http://fairfieldct.org/filestorage/10726/11032/12630/12632/17647/FS_Budget_Presentation.pdf [9] Total spending of $291 million plus non-tax, non-fee revenue of ~$10 million, minus school spending of $185 million = ~$116 million, minus non-resident taxes of ~$35 million = ~$81 million/20,000 households = ~$4,000. If C&I taxpayers pay more than the cost of the actual services they receive (e.g., roads, police, fire), then the value of the benefits to the average Fairfield resident is higher than $4,000. [10] Another interesting perspective on school spending is to imagine that all ~20,000 households had 1.67 students in our schools, the same ratio as the 30% of total households that do at present. That would mean 33,333 students instead of 10,000. At a cost per student of $18,000, we would have to spend $600 million on our schools instead of $185 million. Adding in the remaining $106 million cost of all other public services, our tax levy would have to increase to ~$700 million from $274 million, and with a required mill rate of ~63.85, the property and motor vehicle taxes on the median $525,000 home would increase 2.5x from ~$10,000 to ~$25,000. [11] http://www.fairfieldcitizenonline.com/news/article/500K-cut-from-school-spending-in-marathon-RTM-5456108.php#photo-6264573 [12] Including professional fees and services; “Contingency,” which includes retroactive wage increases; 70% of the annual contribution to the Surplus; the Supplemental Risk Management contributions to cover labor-related costs; and the labor portion of paving costs, then labor is probably 80% of total spending. [13] http://www.courant.com/data-desk/hc-connecticut-population-down-as-people-move-out-20150122-htmlstory.html [14] http://www.fairfieldcitizenonline.com/news/article/Teacher-Town-Hall-worker-contracts-OK-d-by-RTM-5917643.php [15] http://www.fairfieldcitizenonline.com/news/article/Amid-bickering-and-abstentions-RTM-OKs-police-6409330.php [16] http://www.bls.gov/news.release/ecec.nr0.htm [17] http://www.fairfieldtaxpayer.com/uploads/1/1/1/8/11185705/town_budget_approved_--_why_we_should_worry--_final.pdf [18] http://www1.salary.com/CT/Fairfield/Physician-Generalist-salary.html [19] Note that the thresholds for the so-called “Cadillac Tax” (a 40% excise tax) under the Affordable Care Act, scheduled to take effect on January 1, 2018, are $10,200 for an individual and $27,500 for family coverage. [20] http://archive.fairfieldschools.org/downloads/budget/2014-2015BOEBdgtBook2-10-14ReducedBookmarkedLinkedforweb.pdf [21] http://www.fairfieldtaxpayer.com/uploads/1/1/1/8/11185705/town_budget_approved_--_why_we_should_worry--_final.pdf [22] http://www.fairfieldct.org/filestorage/10726/11032/12630/15712/2013-2014_Annual_Financial_Report.pdf – See page 63. [23] http://www.fairfieldct.org/filestorage/10726/11032/12630/12632/27689/27700/PENSION_-_H%26H_Actualrial_Valuation_2.25.2015.pdf [24] For a comprehensive analysis of retirement plan economics, please see this recent article in the Financial Analysts Journal: http://www.cfapubs.org/doi/pdf/10.2469/faj.v69.n6.4
12 Comments
MikeS
9/20/2015 01:37:35 pm
BOE—The elephant in the room that needs major change is the BOE and school budget. Right now, you have a precious few elected officials ( and behind the curtain a spendthrift school board comprised of the lower deciles of rate payers ) in charge of 50%+/- of the town’s budget. This is nuts. The school budget needs to be part of the town-wide budget, subject to the same deliberative process and spending caps. Independently, the town should be able to audit staffing levels and remove the fat from the administrative body.
James P. Bohan
9/21/2015 12:08:40 pm
Compliments to the Fairfield administration for reducing the rate of tax increase.
Jan R. Reber
9/22/2015 06:31:22 am
How does the 7.5% assumed rate of return compare to the assumptions of other towns like Fairfield? Should this assumed rate be gradually modified as part of the FSP? How will rises in interest rates impact Fairfield, and are we planning for increases? Is inflation a risk to the Town finances, and if so what steps are needed to plan for it?
John Wynne
9/23/2015 04:55:39 am
Strengths - we do seem to have a great town.
Doug Jones
9/23/2015 04:05:47 pm
Again, metrics. Re tax rates, taxation per capita is a more apples to apples measure. Crime? Is this violent crime? How many traffic stops of Bridgeport residents, spending money in our stores, BTW, for a broken tail light? Anecdotal observation yields lots of this sort of "crime," if that's what's included. And in terms of objectivity, you are already dragging out the "us versus them" theme pitting the 30 percent with kids in school against those without. As a perennial candidate, I have spoken to many seniors whose kids were educated here and they recognize the value of education, even if they are not now directly benefiting. Again, anecdotal evidence, but there you have it. You are introducing a problem without any objective data to support it.
Abigail
9/23/2015 04:37:34 pm
General observation the "% of total spending" I am assuming should be 100% so how are we spending 63% on education and 70% on labor?
FSP
9/26/2015 05:30:02 am
63% of our budget is directed toward education/37% to projects that are not specifically related to education.
Zeno
9/25/2015 05:07:49 pm
Why was this 'strategic plan' not written from a neutral standpoint?
FSP
9/26/2015 05:25:24 am
Thanks for your comment. I assure you that the specific facts about costs of education (and others in the original plan) were to get facts on the table. What specifically would you suggest the town explore to make Fairfield even more attractive and of greater value to young families? We'll certainly need to invest in some.
Zeno
9/28/2015 11:41:43 am
Facts are not facts until you have the FULL picture. We have no idea if families generally live in bigger houses and contribute 70% of the town's tax base through direct and indirect means, or not. Your 'calculations ' are full of massive omissions, holes and assumptions that would make even the most hardened of politicians or weakest of statisticians, blush.
FPS
9/30/2015 08:24:36 am
Zeno,
Zeno
9/30/2015 10:52:14 am
It is not just my contention it is also the opinion of an earlier comment by Doug "And in terms of objectivity, you are already dragging out the "us versus them" theme pitting the 30 percent with kids in school against those without." Leave a Reply. |
|
||
